Recently, I have been adding varnish to some of my websites to improve their performance. But in the end, how do I know if varnish is helping or not, or if it is helping, can varnish help more? Obviously you…
watch your website and other systems and be alerted if it goes down.
Recently, I have been adding varnish to some of my websites to improve their performance. But in the end, how do I know if varnish is helping or not, or if it is helping, can varnish help more? Obviously you…

If you are using Cacti to monitor and graph all of your SNMP devices in your network then you will probably want to add your VMware ESXi hosts into your Cacti configuration. I have yet to find a good Cacti…

The other day, we had an issue with one of our PostgreSQL databases where one of our applications wasn’t closing its unused connections. We tripled the max_connections and it used all of those up too. While I was monitoring the…

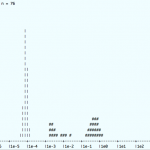
NMAP the Network Exploration Tool and Security / Port Scanner The “Network Mapper” or Nmap (the actual command) is an extremely useful tool for determining what is on your network, what ports UDP or TCP are open, what operating systems…
While you can configure your ReadyNAS to send you alerts about issues with your ReadyNAS device, there is a huge flaw in having a device report about itself … it won’t be able to send you alerts if it is…
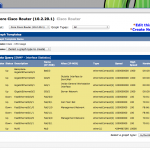
Cacti is an excellent tool to use to monitor your company’s bandwidth usage. It is also very simple to add your routers into your cacti configuration. (Note: If you need instructions on installing cacti, see Install Cacti on CentOS 6). …

Cacti is a great tool for graphing almost anything that talks SNMP. You can use it to graph server performance, file system usage, router interfaces, bandwidth usage, temperature, etc… Because so many have created their own templates for it, there…
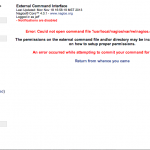
Cannot Run Nagios Service Commands – Could not open command file Error After installing Nagios, everything may appear to be up and running just fine until you attempt to run a service command such as “Re-schedule the next check of this…

Get Detailed Performance Information from Apache You may be looking for a microscope into your Apache httpd service to see how many users you have using it, get performance information, and see the current individual Apache httpd processes and what…
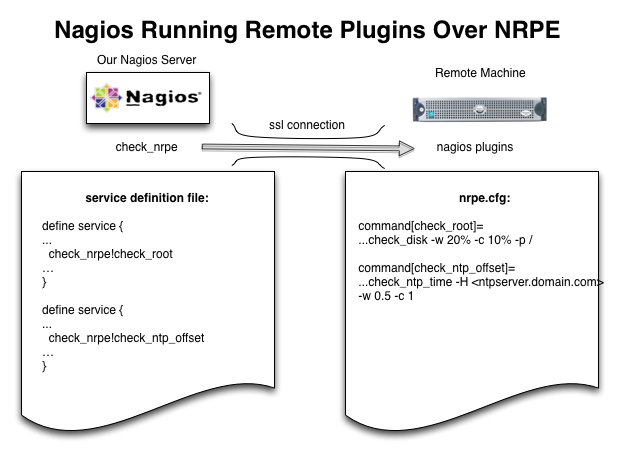
Nagios Remote Plugins with NRPE Two weeks ago, we setup Nagios in the article: Monitoring Your Systems with Nagios and last week, we defined Nagios hosts and services in the article: Configure Nagios Hosts and Services. This week, we will…
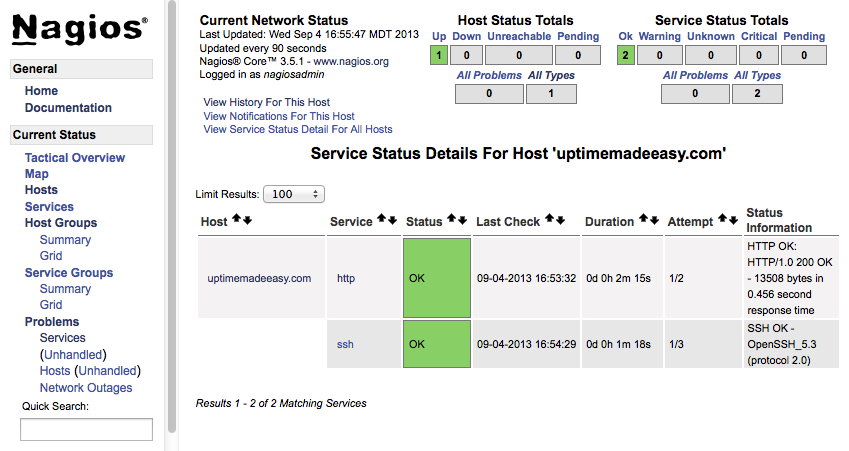
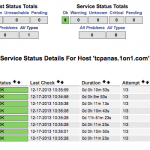
Now that you have Nagios installed (See last week’s article: “Monitoring Your Systems with Nagios” ), you are ready to begin monitoring services such as ssh, websites, and other services. So that brings us to the purpose of this…
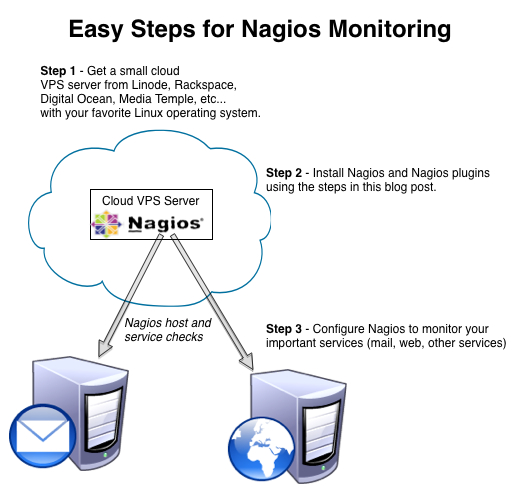
Once you have a system that becomes important to your organization, you will want to begin to monitor it to ensure that it is up and running and to be able to measure and create uptime reports for those services…

Before you read this article – I don’t write about a service that I don’t use, and while this may appear like a product testimonial, well it is. But I only write about it because it solved a problem for…