Benchmark Your Webpage with Siege
A few articles ago, I wrote about using the “apachebench” or “ab” utility to benchmark your website (see: apachebench). Ab is a great tool, but since then, I have found and fallen in love with a new tool for benchmarking your website. This new tool is named “siege”.
Install Siege on CentOS 6
CentOS 6 has added the siege package to the CentOS EPEL (Extra Packages for Enterprise Linux) repository which makes installation easy using yum if you have the EPEL repository installed. If you need to install it still, you can do it using these quick steps:
# wget http://dl.fedoraproject.org/pub/epel/6/x86_64/epel-release-6-8.noarch.rpm
# rpm -Uvh ./epel-release-6-8.noarch.rpm
Preparing...                ########################################### [100%]
package epel-release-6-8.noarch is already installed
Once the EPEL repository is installed, you can go ahead and install the siege package:
# yum install siege
Using Siege to Benchmark Your Website
We can get really detailed usage information on the siege utility in the man pages. We can get a list of the switches that siege can use by using the –help option:
# siege --help
SIEGE 3.0.0
Usage: siege [options]
       siege [options] URL
       siege -g URL
Options:
  -V, --version             VERSION, prints the version number.
  -h, --help                HELP, prints this section.
  -C, --config              CONFIGURATION, show the current config.
  -v, --verbose             VERBOSE, prints notification to screen.
  -q, --quiet               QUIET turns verbose off and suppresses output.
  -g, --get                 GET, pull down HTTP headers and display the
                            transaction. Great for application debugging.
  -c, --concurrent=NUM      CONCURRENT users, default is 10
  -i, --internet            INTERNET user simulation, hits URLs randomly.
  -b, --benchmark           BENCHMARK: no delays between requests.
  -t, --time=NUMm           TIMED testing where "m" is modifier S, M, or H
                            ex: --time=1H, one hour test.
  -r, --reps=NUM            REPS, number of times to run the test.
  -f, --file=FILE           FILE, select a specific URLS FILE.
  -R, --rc=FILE             RC, specify an siegerc file
  -l, --log[=FILE]          LOG to FILE. If FILE is not specified, the
                            default is used: PREFIX/var/siege.log
  -m, --mark="text"         MARK, mark the log file with a string.
  -d, --delay=NUM           Time DELAY, random delay before each requst
                            between 1 and NUM. (NOT COUNTED IN STATS)
  -H, --header="text"       Add a header to request (can be many)
  -A, --user-agent="text"   Sets User-Agent in request
  -T, --content-type="text" Sets Content-Type in request

Copyright (C) 2013 by Jeffrey Fulmer, et al.
This is free software; see the source for copying conditions.
There is NO warranty; not even for MERCHANTABILITY or FITNESS
FOR A PARTICULAR PURPOSE.
so, with these options in mind, allow me to demonstrate a few of the coolest siege options that I like best:
Running Siege for a Specific Time
In the example below, we are using the -q (don’t show output) and the -t option. The -t option allows us to specify a time period for siege to run. We can specify the time in seconds, minutes or hours. In the example below, I run the test for only 5 seconds:
$ siege -q -t5s http://server1.uptimemadeeasy.com

Lifting the server siege...      done.

Transactions:		          87 hits
Availability:		      100.00 %
Elapsed time:		        4.10 secs
Data transferred:	        3.39 MB
Response time:		        0.03 secs
Transaction rate:	       21.22 trans/sec
Throughput:		        0.83 MB/sec
Concurrency:		        0.54
Successful transactions:          87
Failed transactions:	           0
Longest transaction:	        0.03
Shortest transaction:	        0.02
The -c option allows you to set how many simultaneous users to simulate:
$ siege -c 50 -q -t5s http://server1.uptimemadeeasy.com
Using the Siege.log File
You can have siege log statistics for the run by specifying the -l option:
$ siege -c 50 -q -t5s -l siegelog http://server1.uptimemadeeasy.com
The siege.log file will look similar to:
$ cat siege.log
      Date & Time,  Trans,  Elap Time,  Data Trans,  Resp Time,  Trans Rate,  Throughput,  Concurrent,    OKAY,   Failed
2014-02-08 10:01:49,    315,      22.30,          12,       0.30,       14.13,        0.54,        4.21,     315,       3
2014-02-08 10:09:38,    186,      10.94,           7,       0.15,       17.00,        0.64,        2.47,     186,       0
2014-02-08 10:20:03,     82,       3.07,           3,       0.12,       26.71,        0.98,        3.11,      82,       0
2014-02-08 10:34:52,    176,       9.13,           6,       0.08,       19.28,        0.66,        1.50,     176,       0
2014-02-08 10:38:18,    121,       4.28,           4,       0.07,       28.27,        0.93,        1.96,     121,       0
2014-02-08 10:38:31,     87,       4.10,           3,       0.03,       21.22,        0.73,        0.54,      87,       0
2014-02-08 10:45:51,    155,       4.42,           6,       0.18,       35.07,        1.36,        6.15,     155,       0
2014-02-08 10:48:07,    150,       4.46,           5,       0.17,       33.63,        1.12,        5.70,     150,       0
Have Siege Use a List of URLs While having siege check a single page is nice, having siege check on all or at least many pages on your website will help you replicate a more realistic situation in your benchmarking of your Website. In the example below, I add the -f option (file) and the -i option (internet – have the siege run randomly hit the urls in the file listed)
Before I can run this command, I need to prepare the input file (myurls.txt):
# cat myurls.txt
http://www.uptimemadeeasy.com/
Connect to Blocked Ports with SSH Tunneling
Monitoring the Varnish log with Varnishlog
Fixing eth0 MAC Address After VMware Clone or Restore
Monitor VMWare Datastores with Esxtop
Grant Permissions to All Schema Objects to a User in PostgreSQL
Use a SoftPhone for Video Conferencing
Monitor Postgresql with Nagios
Mount a Remote Directory with SSHFS – Coolest Linux Trick Ever!
Disaster Recovery Made Simple With VMWare
Now, I run siege with the options:
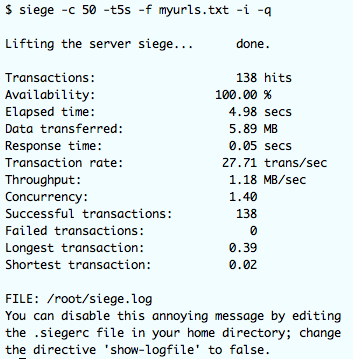
# siege -c 50  -t5s -f myurls.txt -i -q
Lifting the server siege...      done.

Transactions:		         148 hits
Availability:		      100.00 %
Elapsed time:		        4.36 secs
Data transferred:	        6.13 MB
Response time:		        0.03 secs
Transaction rate:	       33.94 trans/sec
Throughput:		        1.41 MB/sec
Concurrency:		        0.95
Successful transactions:         148
Failed transactions:	           0
Longest transaction:	        0.05
Shortest transaction:	        0.02
With all of these options, you can customize your benchmarking of your website and get a fairly good idea of the capabilities of your webpage in terms of simultaneous user counts.
Siege Limitation
While siege will give you the performance of the raw elements of your webpage, for example the static or text elements or how long a php page may take to render, it does not load the other elements of the page such as images, css, or javascript. Remember this when you benchmark your webpage as it is not quite reality.
Latest posts by Jeff Staten (see all)
- Configure Your HP Procurve Switch with SNTP - May 5, 2015
- Configuring HP Procurve 2920 Switches - May 1, 2015
- Troubleshooting Sendmail - November 28, 2014