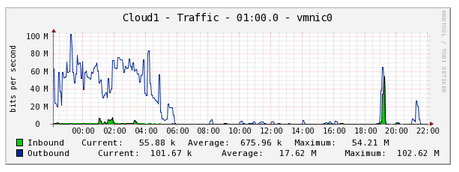
Monitor Esxi with Cacti Graphs
If you are using Cacti to monitor and graph all of your SNMP devices in your network then you will probably want to add your VMware ESXi hosts into your Cacti configuration. I have yet to find a good Cacti ESXi template and I haven’t had time to develop one, but there are plenty of things that you can monitor on an ESXi host using default standard Cacti templates. In just a few minutes, I was able to begin graphing my datastores space used, network interfaces, users logged in, and memory consumed. I suspect that there are others that I will be able to add also without much additional work. This all assumes that you have Cacti installed. If you need help installing Cacti, see the article: Install Cacti on CentOS 6. This articl will help you Monitor VMware ESXi Hosts with Cacti.
Enable SNMP Service in VMware ESXi
The first step is to enable the SNMP service in your VMware ESXi host. You can do this by following the article: Enable SNMP Monitoring on VMware ESXi Hosts. Once that is complete, we move right into adding your ESXi hosts as devices into your Cacti configuration.
Add the VMware vSphere Esxi Host as a Device
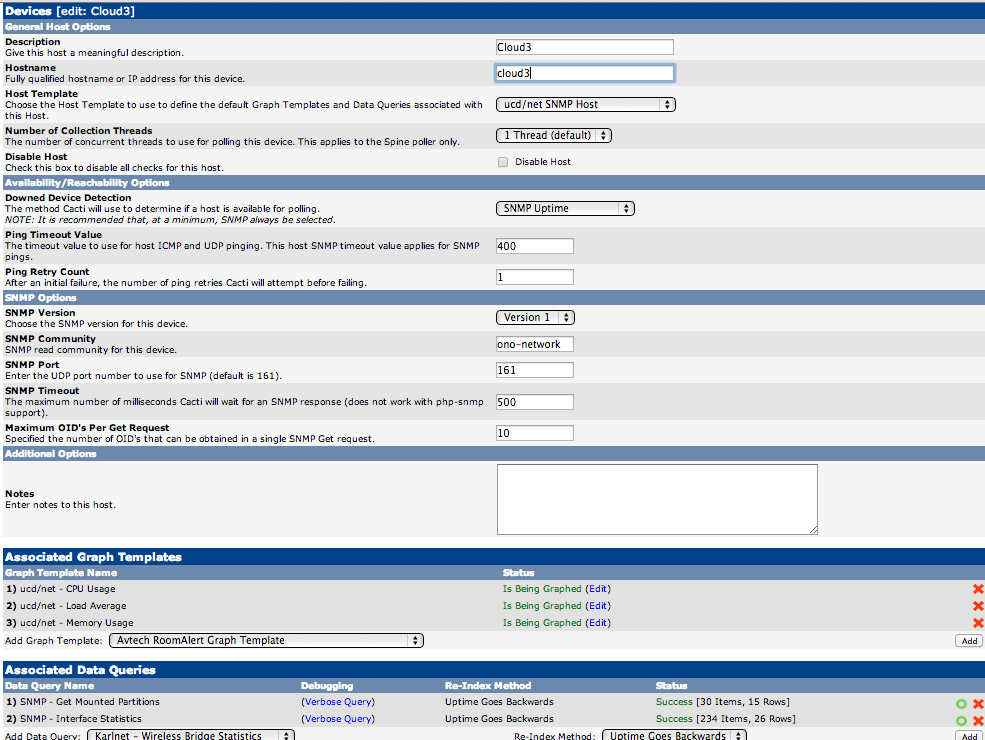
Add VMware ESXi Host to Cacti
Adding your WMware vSphere ESXi host to your cacti implementation is pretty simple. Under the “Console” tab, click “Devices” and then “Add”. This will bring us to the form displayed here. Fill it out with the description, hostname, community string, etc… for your device. Also, be sure to use the “ucd/net SNMP Host” host template.
Associated Data Queries
So, this part is the key to getting your datastores, interfaces and other graphs for your VMware vSphere Esxi hosts. Be sure to have both the:
- SNMP – Get Mounted Partitions, and
- SNMP – Interface Statistics
Associated Data Queries added to your device.
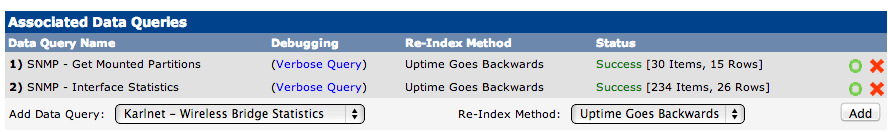
Data Queries for ESXi / Cacti
Create the Graphs for your VMware vSphere Esxi Host

Cacti Create Graphs for This Host
At this point, you should be ready to add the graphs. Click on the “Create Graphs for this Host” link.
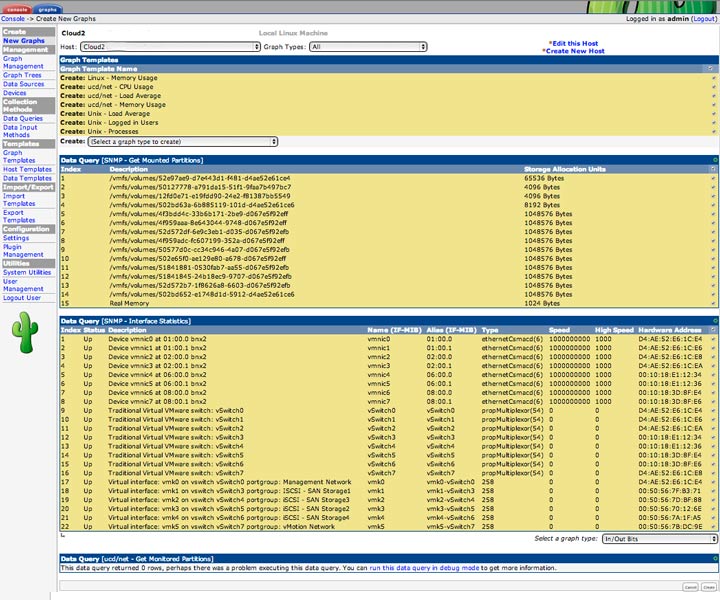
Cacti Add Graphs to Esxi Host
Choose the graphs that you want to add to your host. You should see all of your interfaces, datastores, real memory, etc…
Of course, you will add your host to your graph trees and then review your graphs to see what data you are receiving in your graphs. As you do, you will notice that some of your graph titles need more descriptive titles. In particular, I noticed that my datasource titles were pretty difficult to decipher. To help, I logged in to the cli on my esxi host with ssh to get the list:
# df -h
Filesystem   Size   Used Available Use% Mounted on
VMFS-5     499.8G 127.1G    372.7G  25% /vmfs/volumes/iSCSI-AppServer6
VMFS-5     499.8G 280.1G    219.7G  56% /vmfs/volumes/iSCSI-AppServer5
VMFS-5     499.8G 283.3G    216.5G  57% /vmfs/volumes/iSCSI-AppServer3
VMFS-5       1.5T 979.9G    543.8G  64% /vmfs/volumes/iSCSI-AppServer1
VMFS-5     460.2G  44.7G    415.6G  10% /vmfs/volumes/datastore1
VMFS-5       1.5T 976.6G    523.1G  65% /vmfs/volumes/iSCSI-AppServer7
VMFS-5     499.8G  38.4G    461.4G   8% /vmfs/volumes/iSCSI-AppServer10
VMFS-5     499.8G 237.2G    262.5G  47% /vmfs/volumes/iSCSI-AppServer4
VMFS-5       1.5T 742.7G    757.1G  50% /vmfs/volumes/iSCSI-AppServer8
VMFS-5     499.8G  89.1G    410.6G  18% /vmfs/volumes/iSCSI-AppServer9
vfat         4.0G  28.1M      4.0G   1% /vmfs/volumes/52e833a0-11898494-18e1-d067e5f92efb
vfat       249.7M 148.7M    101.0M  60% /vmfs/volumes/0aad047f-fb6bbff4-f6fe-4817e446bda4
vfat       249.7M 176.7M     73.0M  71% /vmfs/volumes/25ff957e-7675a772-7208-987879a6f14b
vfat       285.8M 191.3M     94.6M  67% /vmfs/volumes/4f070b02-4ab8fdd7-5d4b-d067e5f92efd
I then went back to the device, and went to the graph list and then edited the graphs, matching up the datastore names to the devices using the space used to match them. I then was able to edit the graph titles to finish the job.
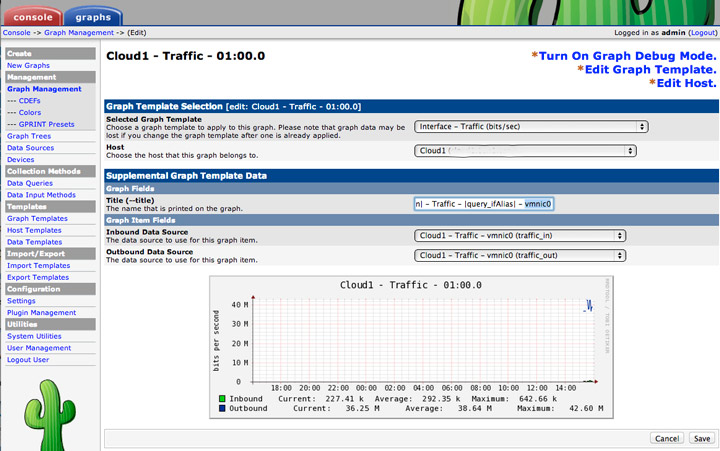
Change Cacti Graph Title
Esxi Default Datastores
You will probably notice that you have some extra datastores left over after you have gone through renaming all of the graphs. These are the default datastores that Esxi uses to manage the system:
- /scratch – is the 4.0GB vfat partition holds logs and diagnostic bundles for your Esxi instance.
- /bootbank – One of the 250MB partitions which is the primary system image. Holds the s.v00 file which is uncompressed into RAM during the boot and is the root of the Esxi system.
- /altbootbank – Is the other 250MB partition which is used as a location for a backup image in the event that there is a problem during an upgrade. You can switch bootbanks at boot time by using the “Shift-R” command.
- /store – is the final vfat partition (285MB) where the vmware tools image is stored and other packages that can be used in your guest vms.
vfat         4.0G  28.1M      4.0G   1% /vmfs/volumes/52e833a0-11898494-18e1-d067e5f92efb
vfat       249.7M 148.7M    101.0M  60% /vmfs/volumes/0aad047f-fb6bbff4-f6fe-4817e446bda4
vfat       249.7M 176.7M     73.0M  71% /vmfs/volumes/25ff957e-7675a772-7208-987879a6f14b
vfat       285.8M 191.3M     94.6M  67% /vmfs/volumes/4f070b02-4ab8fdd7-5d4b-d067e5f92efd
With that introduction to these partitions, you should be able to work your way through the graphs and identify them and then rename the graphs.
Latest posts by Jeff Staten (see all)
- Configure Your HP Procurve Switch with SNTP - May 5, 2015
- Configuring HP Procurve 2920 Switches - May 1, 2015
- Troubleshooting Sendmail - November 28, 2014

hey, nice post, followed it and got basic stats up,
however i can’t seem to find temperatures on this esxi server. anything on the net is dated 2004- so for esxi 3…
any luck running more advanced monitoring for esxi ? like vm usages / cpus per vm usage and temperature of esxi ?
Frank,
If I were to monitor temperature, I would probably use SNMP to monitor the ilo or DRAC which do this task pretty simply. Trying to monitor in Esxi is maybe a level removed from where you want to be.
Jeff