I have been working with Nginx and Varnish for a good little bit. They are both obviously great proxy servers. The question that I have asked myself and others over this time is which should I actually use? Which performs faster? Nginx or Varnish? While a couple hours isn’t much time to do an adequate evaluation, but I was curious, so I took a little extra time to test things out over the last couple of days to get this decided once and for all –or so I thought.
Varnish or Nginx – Which Performs Best?

Creating the Digital Ocean VPS
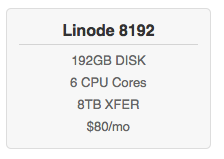
Creating the 8 GB Linode VPS
So, how did I setup my test? I had to move a website to a new VPS so I thought it would be what I tested. The website was a simple WordPress LAMP setup with Apache serving the pages with the WordPress content being stored in a community MySQL database. All of this on an updated CentOS 6.5 VPS. I had learned long ago that not all VPS’s are equal. They all market themselves pretty well to try to convince you that they have what you need. So, to test this out a bit more fully, I tried 2 separate VPS sizes and vendors. I chose a little 1 GB node from Digital Ocean and an 8 GB node from Linode.
The Digital Ocean VPS
I already had these accounts. My Digital Ocean account is where I do a lot of development and testing. I use Digital Ocean for development, because, well, they are very cheap to use. They market their SSD disks as being all that. Someday I may evaluate that, but in the meantime, it was simple to create a “droplet” for the test. My droplet was a puny 1 GB RAM / 1 core processor VPS with a 30 GB disk assignment.
Here’s some more information on the processor for those interested…
Digital Ocean CPU
# cat /proc/cpuinfo
processor : 0
vendor_id : GenuineIntel
cpu family : 6
model : 62
model name : Intel(R) Xeon(R) CPU E5-2630L v2 @ 2.40GHz
stepping : 4
cpu MHz : 2399.998
cache size : 15360 KB
fpu : yes
fpu_exception : yes
cpuid level : 13
wp : yes
flags : fpu vme de pse tsc msr pae mce cx8 apic sep mtrr pge mca cmov pat pse36 clflush mmx fxsr sse sse2 ss syscall nx pdpe1gb rdtscp lm constant_tsc up arch_perfmon rep_good unfair_spinlock pni pclmulqdq vmx ssse3 cx16 pcid sse4_1 sse4_2 x2apic popcnt tsc_deadline_timer aes xsave avx f16c rdrand hypervisor lahf_lm xsaveopt vnmi ept fsgsbase smep erms
bogomips : 4799.99
clflush size : 64
cache_alignment : 64
address sizes : 40 bits physical, 48 bits virtual
power management:
After creating the droplet, I got to work on installing the packages: MySQL, Apache httpd, Nginx and Varnish. For a simple description of how I installed these services, you can refer to previous UptimeMadeEasy articles:
Speed up Your WebPage with Varnish
Install WordPress in a Few Quick Steps
After installing the software above, I moved over the database and the wordpress wp-content directories.
Use Siege to Stress the Server
Next, I needed to find a way to stress the server using a method that would provide me with quantitative metrics that I could use to compare and contrast each test run. I decided to use siege as described in yet another UptimeMadeEasy article: Benchmark Your Webpage with Siege
Generate a List of URLs for Siege
I needed to create a file filled with URLs my webpage content. I used the sitemap that I submit to google and parsed out all of the xml coding for this. If you don’t have a sitemap, you could easily use your access log file and awk out the URLs.
With my file listing my URLs in place, I was ready to siege my webpage. I began sieging my small VPS beginning with a concurrency of 1, then 2, then 3…then 10 against the Nginx service, then I started over again against the Varnish service.
$ siege -c 5 -t60s -f ./uptimeposts -i -q

Lifting the server siege...      done.

Transactions:                 343 hits
Availability:              100.00 %
Elapsed time:               59.48 secs
Data transferred:           17.30 MB
Response time:               0.39 secs
Transaction rate:            5.77 trans/sec
Throughput:                  0.29 MB/sec
Concurrency:                 2.27
Successful transactions:      343
Failed transactions:            0
Longest transaction:         1.38
Shortest transaction:        0.28
Results for the Small VPS
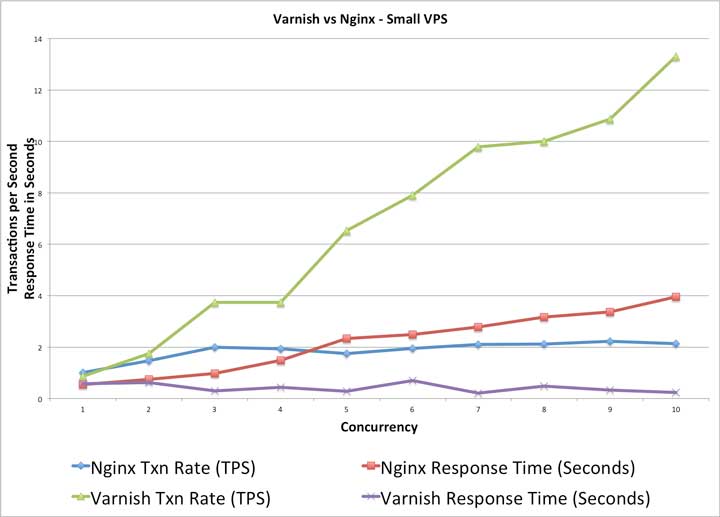
Varnish was the Obvious Answer on the Small VPS
The results for the small VPS were fairly clear. On the graph, we can see that the Varnish service was able to outperform the Nginx service hands down. I repeated the test several times and came to similar results each time.
Below are the actual numbers that the chart is built from:
| Nginx | Varnish Cache | |||
| Nginx Txn Rate (TPS) | Nginx Response Time (Seconds) | Varnish Txn Rate (TPS) | Varnish Response Time (Seconds) | |
| 1 | 1.01 | 0.54 | 0.86 | 0.57 |
| 2 | 1.47 | 0.74 | 1.74 | 0.62 |
| 3 | 2 | 0.97 | 3.74 | 0.29 |
| 4 | 1.93 | 1.48 | 3.74 | 0.43 |
| 5 | 1.75 | 2.34 | 6.53 | 0.28 |
| 6 | 1.95 | 2.48 | 7.91 | 0.7 |
| 7 | 2.1 | 2.78 | 9.78 | 0.21 |
| 8 | 2.12 | 3.16 | 10 | 0.48 |
| 9 | 2.22 | 3.36 | 10.87 | 0.32 |
| 10 | 2.14 | 3.96 | 13.31 | 0.24 |
As I watched the test, the varnish test showed considerably less CPU load as I increased the concurrency. With Nginx, the CPU load increased significantly with added concurrency. In both tests, there was plenty of memory still available.
Results for the Small VPS: Varnish wins in a Landslide.
With that information gathered, I suspected that the larger medium sized VPS would have similar results. I built them the same way, had the same configuration, etc…, but the results were very different!
The Linode VPS
The Linode VPS I used for this test was considerably larger than the smaller Digital Ocean VPS. It was configured with 8 GB of memory and 6 CPU cores and 192 GB of disk space. Below is some more information on the processors:
# cat /proc/cpuinfo
processor : 0
vendor_id : GenuineIntel
cpu family : 6
model : 62
model name : Intel(R) Xeon(R) CPU E5-2680 v2 @ 2.80GHz
stepping : 4
microcode : 0x416
cpu MHz : 2800.074
cache size : 25600 KB
physical id : 1
siblings : 6
core id : 9
cpu cores : 1
apicid : 50
initial apicid : 50
fpu : yes
fpu_exception : yes
cpuid level : 13
wp : yes
flags : fpu de tsc msr pae cx8 apic sep cmov pat clflush mmx fxsr sse sse2 ss ht syscall nx lm constant_tsc rep_good nopl nonstop_tsc eagerfpu pni pclmulqdq ssse3 cx16 sse4_1 sse4_2 popcnt tsc_deadline_timer aes xsave avx f16c rdrand hypervisor lahf_lm ida arat epb xsaveopt pln pts dtherm fsgsbase erms
bogomips : 5602.48
clflush size : 64
cache_alignment : 64
address sizes : 46 bits physical, 48 bits virtual
power management:
Linode VPS Test Results
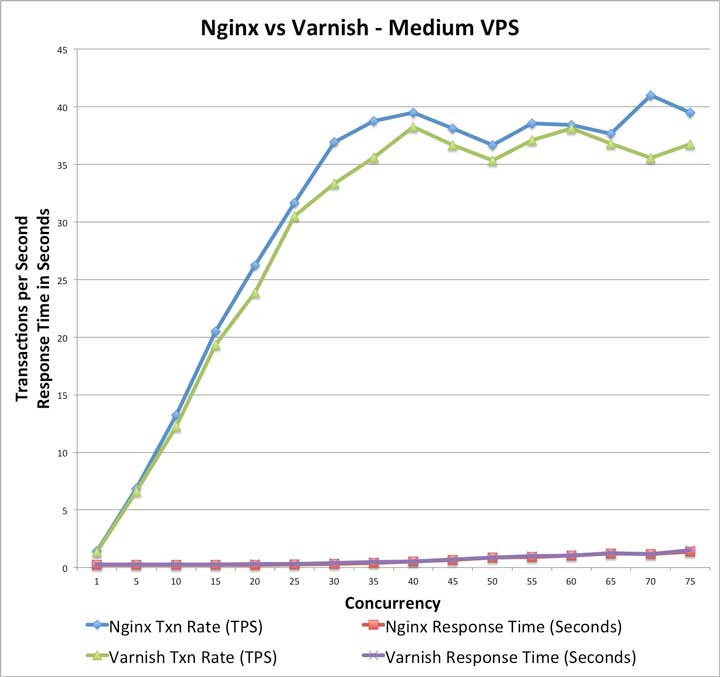 As I mentioned earlier in this article, I had expected the results to follow the smaller VPS results, but found that I was quite wrong.
In this chart, you can see that both Nginx and Varnish scaled quite nicely as we applied higher and higher concurrency rates. Both the Varnish and Nginx tests capped out in the mid to high 40 transactions per second range.
In the end, the Nginx performed slightly better than Varnish Cache.
After seeing the prior results be so different than these, I ran the test several times and arrived at similar results each time.
Below are the actual numbers that this second chart is built from:
| Nginx vs Varnish Cache | ||||
| Nginx | Varnish Cache | |||
| Nginx Txn Rate (TPS) | Nginx Response Time (Seconds) | Varnish Txn Rate (TPS) | Varnish Response Time (Seconds) | |
| 1 | 1.41 | 0.23 | 1.36 | 0.27 |
| 2 | 2.81 | 0.23 | 2.51 | 0.26 |
| 3 | 3.99 | 0.22 | 4.02 | 0.28 |
| 4 | 5.61 | 0.24 | 5.2 | 0.28 |
| 5 | 6.86 | 0.24 | 6.62 | 0.27 |
| 6 | 7.79 | 0.23 | 7.55 | 0.28 |
| 7 | 10.02 | 0.22 | 9.19 | 0.27 |
| 8 | 10.44 | 0.23 | 10.33 | 0.28 |
| 9 | 11.91 | 0.24 | 11.22 | 0.29 |
| 10 | 13.25 | 0.23 | 12.26 | 0.28 |
| 15 | 20.5 | 0.24 | 19.36 | 0.28 |
| 20 | 26.24 | 0.24 | 23.9 | 0.3 |
| 25 | 31.66 | 0.29 | 30.52 | 0.31 |
| 30 | 36.91 | 0.31 | 33.34 | 0.38 |
| 35 | 38.78 | 0.38 | 35.61 | 0.48 |
| 40 | 39.5 | 0.51 | 38.23 | 0.54 |
| 45 | 38.1 | 0.67 | 36.67 | 0.72 |
| 50 | 36.65 | 0.85 | 35.36 | 0.89 |
| 55 | 38.53 | 0.9 | 37.11 | 0.98 |
| 60 | 38.43 | 1.04 | 38.11 | 1.04 |
| 65 | 37.65 | 1.2 | 36.78 | 1.24 |
| 70 | 41 | 1.17 | 35.55 | 1.15 |
| 75 | 39.47 | 1.37 | 36.76 | 1.5 |
In this second test, we were able to grow the concurrency substantially higher than in the first. As we loaded the server for each (Nginx and Varnish Cache) test, the CPU load grew significantly. The memory hardly changed and remained fairly constant.
Results for the Medium-Sized Linode VPS: Nginx wins by a Nose.
So, what in the world can I learn from all of this? The same software, the same Operating System, same configuration, same database, same webpage content, completely different results.
I don’t know, I haven’t had time to spend to figure out why the results of the smaller VPS were so significantly different. I had to get on with the task of moving the webpage to the new server. As the destination was the Linode, I used Nginx in the end for the proxy server and it is working admirably.
Some Day I will come back to the smaller Digital Ocean VPS and figure out what the cause was.
Not All VPS’ are Equal
Nginx or Varnish Which is Faster? Well, it all depends.
One lesson that we can take from all of this is that not all VPS are created equal. Perhaps it was the size of the VPS or it was the vendor’s hardware, but the difference performance was stark.
One thing that I know for sure is that each time I configure a new VPS, I should run it through a quick performance test like I did in this case to ensure that I am using the best configuration possible for the VPS chosen. I found that by doing so in the smaller Digital Ocean VPS case, I would have been much happier with Varnish Cache. In the second instance, I was slightly happier having chosen Nginx.
Give me Your Ideas and Thoughts
I am human like everybody else and you likely have some valuable experience that would be useful to me and other readers of this article. Please comment below with your thoughts on the performance difference. Thank you in advance for your input!
Latest posts by Jeff Staten (see all)
- Configure Your HP Procurve Switch with SNTP - May 5, 2015
- Configuring HP Procurve 2920 Switches - May 1, 2015
- Troubleshooting Sendmail - November 28, 2014