Recently, I have been adding varnish to some of my websites to improve their performance. But in the end, how do I know if varnish is helping or not, or if it is helping, can varnish help more? Obviously you can read one of our other articles on benchmarking your website (see: ab or siege) which will give you information about how quickly your web server is servicing requests, but using the varnishhist utility, you can find out if varnish can do more for you than what you are getting. My hope in this article is to show you all you really need to know about varnishhist
How Much is Varnish Caching?
Of course, All of my websites saw improved performance immediately after putting varnish in front of them. Varnish handles all of the client connections better than Apache, IIS, and other web servers. This alone causes an immediate gain, but varnish is more than a back-end proxy. Varnish can cache your static objects in memory so that when they are requested, the back-end web server does not have to recreate the page and serve up all of the referenced objects again. Instead, varnish will serve those objects from its cache. So now, the big question becomes: Is varnish serving objects from cache or from the back-end.
Varnishhist Shows Varnish Cache Hits vs Cache Misses
Varnishhist is a great tool to help you determine if your varnish cache is serving objects from cache or from the back-end. And one of the beauties of varnishhist is that really all you need to know about it is the following to get at least something useful out of it:
| - represents a cache hit
# - represents a cache miss
That’s all you really need to know to intrepret the following varnishhist output:
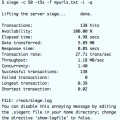
1:1, n = 76

               |
               |
               |
               |
               |
               |
               |
               ||
               ||
               ||
               ||
               ||
               ||
               ||
              |||
              |||
              |||                            ###
              |||         ##                ####
              ||||        ###              ######
             |||||        #### ### #	  ########
+-------+-------+-------+-------+-------+-------+-------+-------+-------
|1e-6   |1e-5   |1e-4   |1e-3   |1e-2   |1e-1   |1e0    |1e1    |1e2
Even though all you really need to know is cache-hits vs cache-misses, there are some other aspects of varnishhist that can be helpful.
Understanding the Rest of the Varnishhist Output
To understand the rest of the output, here are some other things to know. First the “n” variable at the top of the report is the number of requests that varnishhist is reporting on.
n - number of requests
Next, what are the axis to this graph? The y axis displays number of requests –that’s the easy one. The x axis, however, is time, or more specifically, how much time it took between the time varnish received the request to when it delivered a response. So this means that you want more |’s and #’s on the left side of the report than on the right side as left means faster and right means slower.
y axis - displays the number of requests
x axis - displays how long (logarithmic) from received requests to delivered response
So far, that’s easy to get. But what are those x axis units? So, the brains that put varnishhist together must be math geniuses because those units are actually seconds represented in logarithmic expressions.
Once again, all you need to know about the x-axis is:
 1e2 = 100 seconds
 1e1 = 10 seconds
 1e0 = 1 second
 1e-1 = .1 second
 1e-2 = .01 second
 1e-3 = .001 second
 1e-4 = .0001 second
 1e-5 = .00001 second
 1e-6 = .000001 second
Varnishhist Usage and Options
To make varnishhist even more useful, there are some options that you can use to modify how it works.
Varnishhist Options:
-b  displays only communication with back-end servers
-c  displays only communication with clients
-d  display all of the requests in the memory resident varnishlog.  ( I love this one because you don't have to wait for requests to come in to get output)
-i  specify a specific tag
-I  display log entries that match the regular expression you specify with this option
-C  ignore upper and lower case in your regular expressions
-n  if you have multiple varnish instances, specify the instance
-r  read log entries from the specified file instead of shared memory
-V  display the version of varnishhist
-w  wait time between updates
-x  exclude log entries with the tag you list here
Latest posts by Jeff Staten (see all)
- Configure Your HP Procurve Switch with SNTP - May 5, 2015
- Configuring HP Procurve 2920 Switches - May 1, 2015
- Troubleshooting Sendmail - November 28, 2014