I mentioned in another article (Speed Up Your Webpage with Varnish) some of the benefits of Varnish Cache. It provides excellent caching and proxying which can provide a nice performance boost for your website. Another benefit in varnish cache is in how it handles its logs. Unlike most utilities and applications, it doesn’t write logs to a file. This helps performance. Instead, varnish writes to shared memory. So, how do you get to the varnish logs? With the “varnishlog” utility, of course! This article explains Monitoring the Varnish log with Varnishlog.
Using Varnishlog to get Varnish Logging
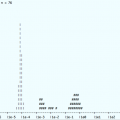
Below is an example of varnishlog output for a request for one of my articles.
$ varnishlog
   12 SessionOpen  c 50.160.113.166 62163 :80
   12 ReqStart     c 50.160.113.166 62163 1420323936
   12 RxRequest    c POST
   12 RxURL        c http://www.uptimemadeeasy.com/articles/speed-up-your-webpage-with-varnish/
   12 RxProtocol   c HTTP/1.1
   12 RxHeader     c Host: www.uptimemadeeasy.com
   12 RxHeader     c User-Agent: Mozilla/5.0 (Macintosh; Intel Mac OS X 10_9_1) AppleWebKit/537.36 (KHTML, like Gecko) Chrome/32.0.1700.102 Safari/537.36
   12 RxHeader     c Content-Type: application/x-www-form-urlencoded; charset=UTF-8
   12 RxHeader     c Referer: http://www.uptimemadeeasy.com/wp-admin/post-new.php
   12 RxHeader     c Accept-Encoding: gzip,deflate,sdch
   12 RxHeader     c Accept-Language: en-US,en;q=0.8
   12 Backend      c 14 uptime uptime
   12 TTL          c 1420323936 RFC 0 -1 -1 1391302643 0 1391302643 442645200 0
   12 VCL_call     c fetch
   12 TTL          c 1420323936 VCL 120 -1 -1 1391302643 -0
   12 VCL_return   c hit_for_pass
   12 ObjProtocol  c HTTP/1.1
   12 ObjResponse  c OK
   12 ObjHeader    c Date: Sun, 02 Feb 2014 00:57:23 GMT
   12 ObjHeader    c Server: Apache/2.2.15 (CentOS)
   12 ObjHeader    c X-Powered-By: PHP/5.3.3
   12 ObjHeader    c Access-Control-Allow-Origin: http://www.uptimemadeeasy.com
   12 ObjHeader    c Access-Control-Allow-Credentials: true
   12 TxProtocol   c HTTP/1.1
   12 TxStatus     c 200
   12 TxResponse   c OK
   12 Length       c 260
   12 ReqEnd       c 1420323936 1391302643.138757229 1391302643.414440155 0.000071526 0.275578260 0.000104666
Varnishlog Columns
There are 4 columns in this output. The columns are as follows:
- Request Number – this number helps you identify the lines specific per each request.
- Tag – This identifies the type of data in the line. Common tags are: RxURL (received URL), TxURL (URL send by Varnish), RxHeader (request header), TxHeader (A header sent from Varnish), RxRequest (Request method: post, get), TxStatus (Status code sent by Varnish), RxStatus (Received status code), ReqEnd (has timing numbers on the request)
- Communication Source – Either b (backend communication), c (client communication), misc (thread collection)
- Data – The Line data.
There are some Useful options you can use to filter the output of the varnishlog command:
-i     Show output for the specified tag
-n     the name of the varnish instance if you are running multiple instances
-m     display only tags with specific output (TxStatus:404)
-c     display communication with clients only
-b     display communication with the backend only
Varnishlog Ping Pong Output
When there isn’t any traffic, you will likely see varnishlog output similar to the following:
    0 CLI          - Rd ping
    0 CLI          - Wr 200 19 PONG 1391305596 1.0
This is just the varnish process checking up on its caching process (ping) and then the response back (pong). These is normal activity.
Latest posts by Jeff Staten (see all)
- Configure Your HP Procurve Switch with SNTP - May 5, 2015
- Configuring HP Procurve 2920 Switches - May 1, 2015
- Troubleshooting Sendmail - November 28, 2014