The other day, we had an issue with one of our PostgreSQL databases where one of our applications wasn’t closing its unused connections. We tripled the max_connections and it used all of those up too. While I was monitoring the host with nagios, I hadn’t implemented much monitoring of PostgreSQL itself other than to use check_procs to alert me if it was down:
command[check_postgres-process]=/usr/lib64/nagios/plugins/check_procs -c 1:1 -a 'postmaster -p 5432 -D'
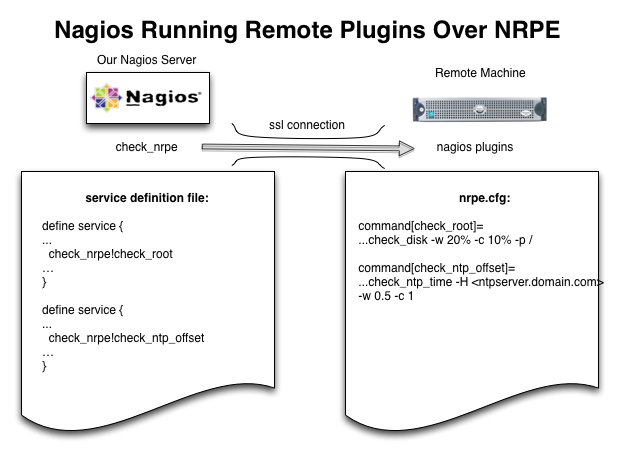
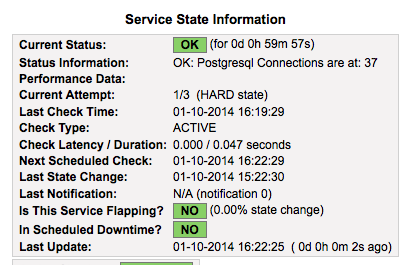
So I went looking for options on how to monitor PostgreSQL with Nagios and came up with this short list in addition to using check_procs as shown above as it is in my nrpe.cfg file.
Use the Built-in Nagios Plugin check_pgsql to Verify PostgreSQL Connectivity
The simplest, quickest check to implement is to use the built-in check_pgsql plugin. While this doesn’t count the number of connections currently being used, it does prove if it can connect or not which is the essential part anyway. I won’t go into all of the details as you can decide to use a the check_pgsql plugin from your nagios server or using a remote nrpe check like I did. If you want to do it with a remote nrpe check, I wrote another article about using remote plugins with nrpe that you can reference to help you fill in the details. In the end, the plugin needs to be run similar to this:
$ /usr/lib64/nagios/plugins/check_pgsql -Hpostgresserver.uptimemadeeasy.com -P5432 -pmypassword -dmydatabase -lmypguser

OK - database mydatabase (0 sec.)|time=0.000000s;2.000000;8.000000;0.000000
That works pretty well and proves that at least one connection is available in PostgreSQL.
Custom Plugin to Count PostgreSQL Connections with Netstat
Monitor Postgresql Connections with Nagios
To resolve my initial issue, I just quickly went to netstat to review the connections to my PostgreSQL port. While not perfect, it worked for me because all of my connections were coming in through tcp. I have included the fast script that I put together here. Use at your own risk and feel free to improve upon it as you wish.
#!/bin/bash

# Nagios States
STATE_OK=0
STATE_WARNING=1
STATE_CRITICAL=2
STATE_UNKNOWN=3
STATE_DEPENDENT=4

WARN_THRESHOLD=200
CRITICAL_THRESHOLD=250

CONNECTIONS=`/bin/netstat -an | /bin/awk '{print $4}' | /bin/grep 5432 | /usr/bin/wc -l`

if [ ${CONNECTIONS} -gt ${CRITICAL_THRESHOLD} ]
  then
      echo "CRITICAL: Postgresql Connections are high: ${CONNECTIONS}!!"
      exit ${STATE_CRITICAL}
  else
      if [ ${CONNECTIONS} -gt ${WARN_THRESHOLD} ]
        then
          echo "WARNING: Postgresql Connections are getting high: ${CONNECTIONS}!!"
          exit ${STATE_WARNING}
        else
          echo "OK: Postgresql Connections are at:  ${CONNECTIONS}"
          exit ${STATE_OK}
      fi
fi
While not perfect, this quickly resolved my issue and gave me a quick idea of how many connections were being used.
$ /usr/lib64/nagios/plugins/contrib/check_postgresconnections.sh

OK: Postgresql Connections are at:  188
Use Bucardo’s Check_postgres.pl Plugin
To finish off the task, I downloaded the check_postgres.pl perl script from http://bucardo.org/wiki/Check_postgres. Check_postgres.pl handles many of the typical things that you may want to check. I don’t want to steal thunder from Bucardo’s webpage, but below is a simple example of how it can be used:
# /usr/lib64/nagios/plugins/check_postgres.pl -v  --host=postgresserver.uptimemadeeasy.com --dbuser=myuser --dbpass=mypassword --action bloat

POSTGRES_BLOAT OK: DB "postgres" (host:prizm.1on1.com) (db postgres) table pg_catalog.pg_rewrite rows:106 pages:12 shouldbe:2 (6.0X) wasted size:81920 (80 kB) | time=0.31
pg_catalog.pg_rewrite=81920 pg_catalog.pg_depend=24576 pg_catalog.pg_collation=16384 pg_catalog.pg_amop=8192 pg_amop_oid_index=16384 pg_catalog.pg_amproc=8192 pg_amproc_fam_proc_index=16384 pg_amop_fam_strat_index=16384
As a quick note, I did have to edit the script slightly to make it work properly. I entered the path to my psql binary:
$PSQL = '/usr/pgsql-9.2/bin/psql';
I also changed the $NO_PSQL_OPTION from 1 to 0
our $NO_PSQL_OPTION = 0;
Bucardo’s check_postgres.pl script will perform lots of other checks. You can get more information by running it with the help option:
# /usr/lib64/nagios/plugins/check_postgres.pl --help
Latest posts by Jeff Staten (see all)
- Configure Your HP Procurve Switch with SNTP - May 5, 2015
- Configuring HP Procurve 2920 Switches - May 1, 2015
- Troubleshooting Sendmail - November 28, 2014