Before you read this article – I don’t write about a service that I don’t use, and while this may appear like a product testimonial, well it is. But I only write about it because it solved a problem for me in the past and still does today.
How I Came to Dotcom-Monitor
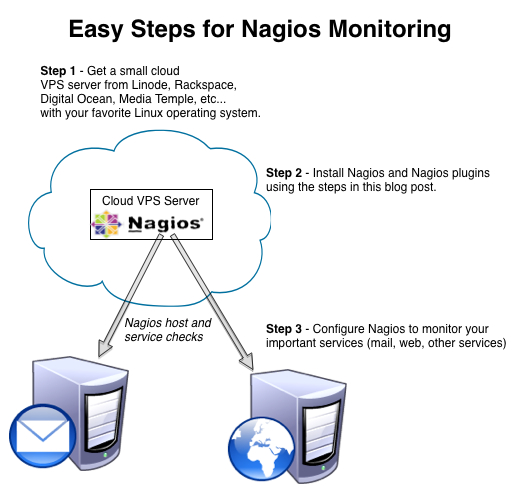
I have used dotcom-monitor for the last 4 years or so, but I haven’t always. I initially was using Nagios only and I still do use Nagios for tons and tons of monitoring, but I got in a trap once where Nagios didn’t warn me about a problem with my website and it cost me.
About 4 years ago, I had my priority website up and running with customers and everybody happy. Nagios was keeping me in touch with uptime and I thought I had it all. Then my boss came to me and told me that people were telling me that they were having intermittent problems getting to the website. “How could that be?”, I argued back and I went to investigate. What was happening was a problem with the service I was using for DNS. Their DNS servers were having intermittent issues and because the TTL was set to 1 hour, my Nagios machine and my company DNS servers kept it cached in their DNS cache. My Nagios server was always able to reach the website even during the DNS issues because of the caching.
This is what convinced me that I needed dotcom-monitor. While I still use Nagios for monitoring file system usage, cpu, memory, swap, process listings, database connections, esxi, hardware health, routers, you name it, I will always use dotcom-monitor for my priority web sites because it clears its DNS cache before each check and it checks from lots of different locations around the planet.
Dotcom-Monitor Tour
So, the easiest way to begin with dotcom-monitor is to create a free 30 day trial account right from their website. When you create a ServerView device monitor in the dotcom-monitor interface, you choose from the different available device types to find the one that best fits what you would like to monitor. I chose “Web Site” because that was exactly what I was monitoring.

Creating a Device Monitor in Dotcom-Monitor
Next, I told it the URL of my website:
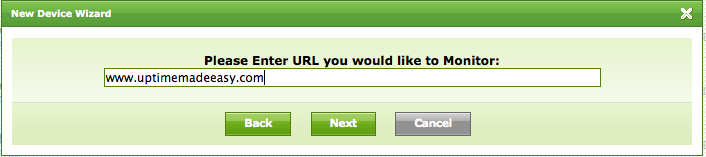
Type in the FQDN
Next, I told it the email address where I wanted reports and alerts sent to. Because I needed to know instantly if there was an issue with my website, I put in the email to SMS email address for my mobile phone so I would get a text message instantly if a problem was discovered.

Dotcom-monitor has 4 different monitoring options: ServerView, BrowserView, UserView, or LoadView monitoring options.
Now, I get to choose among the different options:
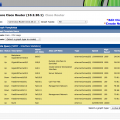
- ServerView – I used ServerView monitoring for a couple of years. It is plain and simple monitoring of your website with uptime reports and alerting from Dotcom-Monitor’s servers around the planet. Everything that you would expect.
- BrowserView – I am currently using BrowserView monitoring. This is similar to ServerView monitoring, but I get to choose from either Internet Explorer, Firefox, or Chrome.
- UserView – Allows you to record a series of steps with your browser from your workstation against your website using the dotcom-monitor macro recorder. This can give you an idea of how your page forms or shopping cart works for end users.
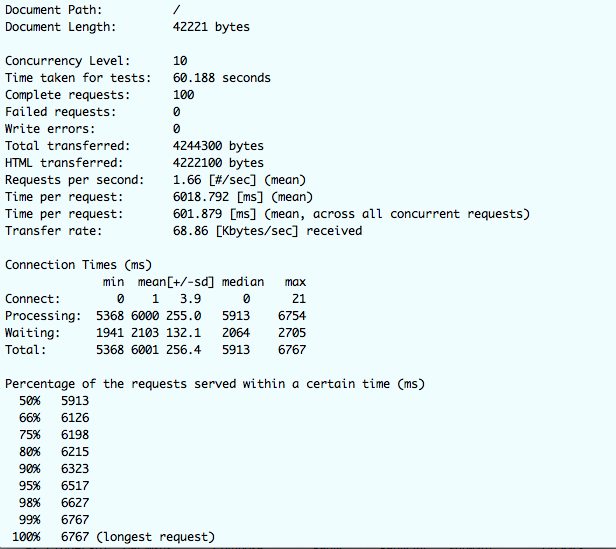
- LoadView – Allows you to load test your website. Tells you the performance you can expect at different quantities of users.
When you create a ServerView or BrowserView monitoring device, you can choose from servers all over the planet, or you can choose just those that interest you.

Dotcom-monitor allows you to choose from monitoring servers all over the globe.
ServerView monitoring devices allow you to configure expected keyword return values as well as configure parameters for your web page scripts to handle.
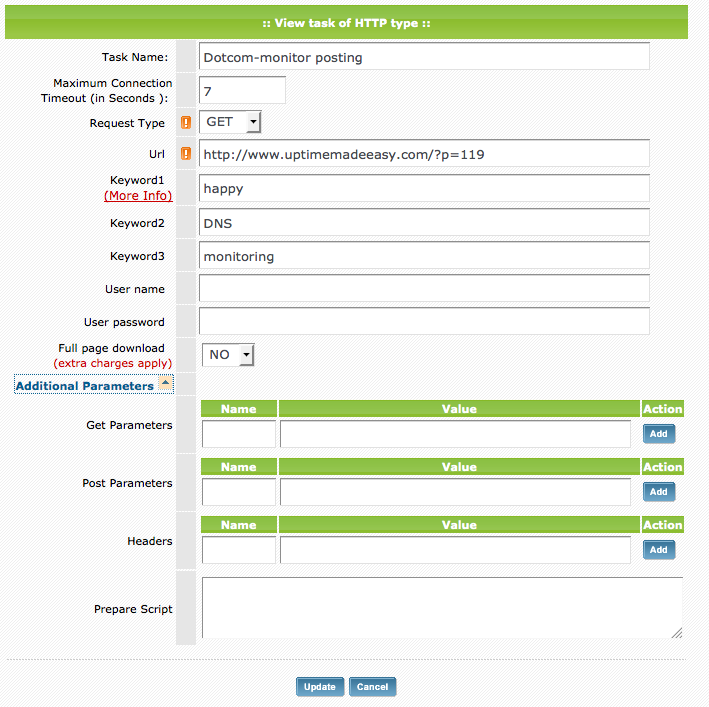
Dotcom-monitor allows you to setup keywords to expect, or and even allows you to send parameters to your webpage scripts.
My favorite part of dotcom-monitor are the reports. You can have them emailed to you or you can view them by logging in to their website. Below is an example of the Performance Report that comes with BrowserView reporting. Each object on the page is measured for how long it took to load with Orange being DNS lookup, purple connection, red SSL, light blue request, green first packet, and dark blue download.
This helps you find broken links, slow DNS, heavy images, etc…
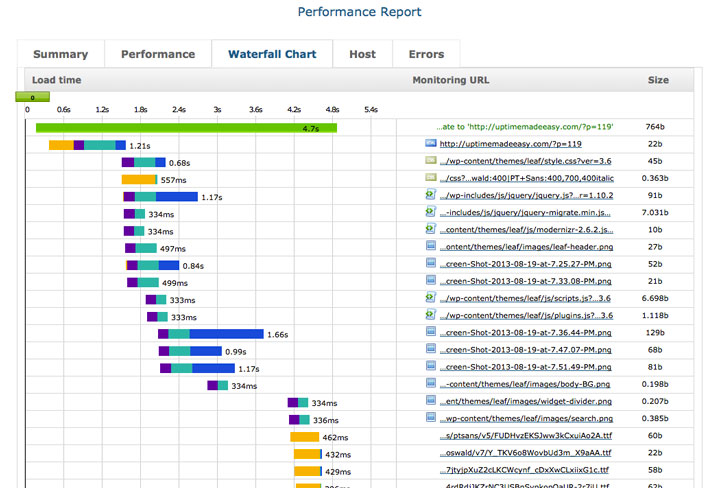
BrowserView reports include awesome waterfall charts detailing your website’s performance
Now, when my phone goes off in the middle of the night, I don’t have to spend anytime at all thinking or troubleshooting. The problem is detailed in the performance report. I can quickly resolve the problem and go back to sleep knowing that while I am sleeping, dotcom-monitor has my back.
Latest posts by Jeff Staten (see all)
- Configure Your HP Procurve Switch with SNTP - May 5, 2015
- Configuring HP Procurve 2920 Switches - May 1, 2015
- Troubleshooting Sendmail - November 28, 2014
How much do you have to pay after the trial if you want to have the software on about 10 PCs? I think that it is not going to be cheap. I ahve found a tool which is called Anturis, that is cloud-based one and accoridng to the reviews it is not bad, but I have never used the clouds.
Melissa,
Pricing all depends on the features, check frequency, and quantity of checks you purchase. Anturis offers simpler checks and has a very reasonable price. You can also look at Pingdom and tons of others. The purpose of this article was to show some of the premium features that you get with Dotcom-monitor’s premium browser view service which gives you a great view into each page and why it may be failing. If you don’t need some of those features, go with a cheaper option.
Jeff