Apachebench Bench Marking – How Fast is my Webpage?
Before you deploy your website for the masses, you may want to performance tune it to make it run faster and serve more users. A simple tool that you can use to begin benchmarking your website with is apachebench or “ab”. To get ab, you simply need to have a machine with apache installed. While you can run it from the same machine as your webpage, it can also be more realistic to run it from a separate machine. Find a machine with apache installed on it and you should have ab installed on it also.
Benchmark, Tune, Benchmark Again
When I have bench marked with ab, I have always followed a simple pattern:
- Run an ab test and save the results
- Make one change in the Apache or database configuration
- Restarted Apache or the database
- Re-run the exact same ab test to see if the change improved or worsened performance
Apachebench Usage
I do most of my ab benchmarking with just 3 simple parameters:
ab -c <concurrent requests to make> -n <total number of requests to perform> http://url/
remember the / at the end of the URL.
Example:
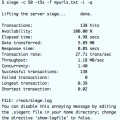
| $ ab -c 10 -n 100 http://mywebsiteurl.com/ This is ApacheBench, Version 2.0.40-dev <$Revision: 1.146 $> apache-2.0 Copyright 1996 Adam Twiss, Zeus Technology Ltd, http://www.zeustech.net/ Copyright 2006 The Apache Software Foundation, http://www.apache.org/Benchmarking uptimemadeeasy.com (be patient)…..doneServer Software: Apache/2.2.15 Server Hostname: mywebsiteurl.com Server Port: 80Document Path: / Document Length: 42221 bytesConcurrency Level: 10 Time taken for tests: 59.334801 seconds Complete requests: 100 Failed requests: 0 Write errors: 0 Total transferred: 4244300 bytes HTML transferred: 4222100 bytes Requests per second: 1.69 [#/sec] (mean) Time per request: 5933.480 [ms] (mean) Time per request: 593.348 [ms] (mean, across all concurrent requests) Transfer rate: 69.84 [Kbytes/sec] receivedConnection Times (ms) min mean[+/-sd] median max Connect: 31 31 0.9 32 33 Processing: 5525 5887 78.3 5901 6028 Waiting: 1721 2013 55.0 2026 2090 Total: 5557 5919 78.4 5933 6059 WARNING: The median and mean for the initial connection time are not within a normal deviation These results are probably not that reliable.Percentage of the requests served within a certain time (ms) 50% 5933 66% 5950 75% 5962 80% 5975 90% 6014 95% 6022 98% 6025 99% 6059 100% 6059 (longest request) |
Ab Can Help Improve Website Performance
Using the method explained above with ab, I have been able to significantly improve the performance of my webpages. Specifically, I look at the “Percentage of Requests Served Within a Certain Time” section to watch for better numbers after the configuration changes. Now you can benchmark your website using ab.
Latest posts by Jeff Staten (see all)
- Configure Your HP Procurve Switch with SNTP - May 5, 2015
- Configuring HP Procurve 2920 Switches - May 1, 2015
- Troubleshooting Sendmail - November 28, 2014