Top Showing Swap Being Available
Nearly every sysadmin has become familiar with the top command. It displays a list of the processes running on the System in a real-time dynamic interface. While Top is great without knowing much about it, adding some filtering and sorting and other options, the “top” command becomes an even better tool.
Top: Show processes running for a specific user only
On busy systems, the processes can be bouncing on and off the list making it difficult to monitor the processes that you want. The best way to handle this is filter the processes. One way that you can filter the processes is by the user running the proceses. You can do this by using top with the “-u” flag.
Example: Use top to display processes running for the “mysql” user
$ top -u mysql
top - 22:54:53 up 34 days, 1:29, 1 user, load average: 0.03, 0.01, 0.00
Tasks: 91 total, 1 running, 90 sleeping, 0 stopped, 0 zombie
Cpu(s): 0.3%us, 0.3%sy, 0.0%ni, 99.3%id, 0.0%wa, 0.0%hi, 0.0%si, 0.0%st
Mem: 1020584k total, 941668k used, 78916k free, 183772k buffers
Swap: 1048568k total, 20564k used, 1028004k free, 341712k cached

 PID USER PR NI VIRT RES SHR S %CPU %MEM TIME+ COMMAND
 1442 mysql 20 0 630m 38m 2944 S 0.0 3.8 27:21.35 mysqld
Above, we were able to get top to display only the processes belonging to the mysql user. So nice to have all of the other processes filtered out.
Top: Show Processes with Specific PIDs
What if we wanted to watch several specific processes running on our Linux box with one top command, filtering out all of the others? For example, let’s imagine that we have a LAMP Server (Linux, Apache, MySQL, PHP) box that also has an ftp daemon and we want to monitor just those several processes. This is now simple using top and the “-p” command listing the PIDs of the processes. Prior to running this command, run a quick ps command and get the PIDs of these processes, then we run “top -p <PIDs>” as shown below.
Example: Use top command to display only the vsftpd, mysqld, and httpd processes on our server.
$ top -p 14363,21918,1442
top - 23:19:33 up 34 days, 1:54, 1 user, load average: 0.02, 0.02, 0.00
Tasks: 3 total, 0 running, 3 sleeping, 0 stopped, 0 zombie
Cpu(s): 0.3%us, 0.0%sy, 0.0%ni, 99.7%id, 0.0%wa, 0.0%hi, 0.0%si, 0.0%st
Mem: 1020584k total, 939456k used, 81128k free, 188084k buffers
Swap: 1048568k total, 20560k used, 1028008k free, 333648k cached

 PID USER PR NI VIRT RES SHR S %CPU %MEM TIME+ COMMAND
14363 root 20 0 295m 9.8m 2392 S 0.0 1.0 0:26.65 httpd
21918 root 20 0 52440 240 184 S 0.0 0.0 0:00.47 vsftpd
 1442 mysql 20 0 630m 38m 2944 S 0.0 3.8 27:22.41 mysqld
And with that, our top command filters out all of the other unwanted processes so we can focus on these three.
Write Top Output to a File
Sometimes, it can be useful to capture top output to a file. The best way to do this is to use the “-b” option that configures top to format its output in a more suitable format for a file.
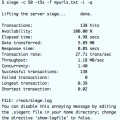
Example: Below, we send all top output on processes for the “mysql” user (-umysql), using a refresh of 60 seconds (-d60), with 5 iterations (-n5) all nicely formatted to look good in a file (-b).
$ top -b -n5 -d60 -umysql > ./mytopoutput
Sorting Top’s Output by Memory, PID, CPU Usage
In addition to filtering top’s output, you can also change how it is sorted.
Sort By… |
KeyStroke |
| Sort by CPU Time Consumed | shift+t |
| Sort by PID | shift+n |
| Sort by Memory Usage | shift+m |
| Sort by CPU Usage | shift+p |
| Sort by Next Column to the Right | shift+> |
| Sort by Next Column to the Left | shift+< |
| Return to the original sorting | = |
Other Top Options
In addition to all of the filtering and sorting options listed above, there are a couple of other top options that we’ll discuss in this article.
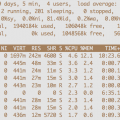
Killing Processes Using Top
Sometimes while you are monitoring processes with top, you find one that you will want to kill. This can be done by typing a “k” while monitoring the processes. You will be asked to type the PID that you wish to kill, followed by the signal number that you want to use to kill the process. You can find more about process signals in a prior article at uptimemadeeasy.com: Killing Linux Processes.
Example: Killing processes from inside of the top command.
$ top
top - 00:35:09 up 34 days, 3:10, 1 user, load average: 0.00, 0.04, 0.00
Tasks: 93 total, 1 running, 92 sleeping, 0 stopped, 0 zombie
Cpu(s): 0.7%us, 0.3%sy, 0.0%ni, 99.0%id, 0.0%wa, 0.0%hi, 0.0%si, 0.0%st
Mem: 1020584k total, 797588k used, 222996k free, 199108k buffers
Swap: 1048568k total, 20552k used, 1028016k free, 218772k cached
PID to kill:
 PID USER PR NI VIRT RES SHR S %CPU %MEM TIME+ COMMAND
29610 jstaten 20 0 15024 1244 968 R 0.3 0.1 0:00.01 top
 1 root 20 0 19228 512 356 S 0.0 0.1 0:11.52 init
 2 root 20 0 0 0 0 S 0.0 0.0 0:00.00 kthreadd
 3 root RT 0 0 0 0 S 0.0 0.0 0:00.00 migration/0
 4 root 20 0 0 0 0 S 0.0 0.0 0:27.16 ksoftirqd/0
 5 root RT 0 0 0 0 S 0.0 0.0 0:00.00 migration/0
Changing a Process’ Priority From Inside Top
In addition to killing processes inside of top, you can also reprioritize their nice value or priority. You can do this by typing the “r” command (renice) from the top processlist and typing the PID number and then the new negative number that you want to use as a priority. For more information about nice and reprioritizing processes, you can find more information in a prior uptimemadeeasy article titled: Adjust Process Priority with Nice and Renice
More information on Top
You can find more information on top using these links:
http://en.wikipedia.org/wiki/Top_%28software%29
http://linux.about.com/od/commands/l/blcmdl1_top.htm
Latest posts by Jeff Staten (see all)
- Configure Your HP Procurve Switch with SNTP - May 5, 2015
- Configuring HP Procurve 2920 Switches - May 1, 2015
- Troubleshooting Sendmail - November 28, 2014